Every field team learns this lesson the same way: the hard way. Data collection wraps, the enumerators go home, and someone opens the export in Excel or Stata expecting a clean dataset ready for analysis. Instead they find three submissions for the same household, a respondent age of 340, GPS coordinates sitting in the Arabian Sea, and a block of "male / employed / secondary school / yes / yes / yes / yes" answers that look suspiciously identical across sixty rows. This is not a rare occurrence. It is the default state of raw survey data, and it happens whether your enumerators are careful and conscientious or not, simply because collecting data in the field — often offline, often on shared devices, often under time pressure — introduces failure modes that no amount of good intentions eliminates.
The mistake most teams make is treating cleaning as an afterthought: a rushed pass in a spreadsheet the week before the report is due, done by whoever is free, with no consistent method. The result is inconsistent cleaning decisions, cleaning that misses systematic problems because no one looked for them specifically, and — worst of all — a dataset where nobody can say with confidence how clean it actually is. A "second pass" approach fixes this by treating cleaning as a defined, repeatable workflow with named checks, not a vague tidying exercise.
Why raw field data is always dirty
Before the workflow, it's worth understanding why field data arrives messy, because the reasons shape which checks matter most.
Duplicate submissions from sync retries
Offline-first data collection apps queue submissions locally and push them to the server when connectivity returns. This is exactly the resilience field teams need on India's patchy rural 2G/3G networks — but it also creates a classic double-submission risk. An enumerator taps "Submit," the app appears to hang because the sync is slow, they assume it failed, and they resubmit. Or a device syncs the same queued record twice across a flaky connection before receiving server acknowledgment. Either way, you end up with two (or more) records for one real-world interview, and if nobody dedupes them, that respondent gets double-counted in every downstream tabulation.
Fat-finger numeric entry errors
A monthly income field meant to hold ₹15,000 becomes ₹150,000 because of a stray zero. A household size of 5 becomes 55 because the enumerator's thumb hit the "5" key twice on a small screen. These errors are individually small but collectively dangerous — a single ₹15,00,000 income entry in a village survey can swing a mean income statistic by an order of magnitude.
Inconsistent categorical labels and spelling variants
Open-text or loosely constrained fields ("occupation," "crop grown," "caste category") accumulate spelling variants over hundreds of interviews and multiple enumerators: "Farmer," "farmer," "Farming," "Agri," "krishi." Without standardization, a simple frequency count treats these as five separate categories instead of one, silently distorting every cross-tab that touches the field.
GPS drift and null-island coordinates
Consumer-grade GPS on mobile devices can drift by tens or even hundreds of metres, especially indoors or under tree cover — common conditions for household interviews. Worse, when a device fails to acquire a GPS fix at all, some apps silently record (0, 0) — a point in the Atlantic Ocean off the coast of West Africa, informally called "null island." A dataset with several respondents apparently living in the ocean is an obvious red flag, but subtler drift (a respondent plotted three villages away from their actual cluster) is much harder to catch without a systematic check.
Straight-lining and suspiciously fast submissions
When an enumerator is behind schedule, tired, or simply cutting corners, two patterns emerge: straight-lining (selecting the same response option — often the middle or first choice — for every item in a scale or matrix question, regardless of content) and unrealistically fast completions (a 45-question household survey submitted in 90 seconds is not a real interview). Both indicate the interview was rushed or possibly never happened.
The systematic second-pass workflow
Instead of an unstructured cleanup, run every dataset through the same five-stage sequence, in this order, because later stages depend on earlier ones being resolved first (you don't want to compute outlier statistics on a dataset that still contains duplicate rows, for instance).
Stage 1: Deduplication
Identify candidate duplicates using a combination of exact-match keys (respondent ID, phone number, household ID if collected) and near-duplicate logic on a fingerprint of stable fields (name, village, head-of-household age, GPS cluster). Exact duplicates from sync retries are usually easy — same submission ID or identical timestamps seconds apart. Near-duplicates from a genuine repeat visit or enumerator confusion require a human decision: keep the more complete record, keep the later one if it was a deliberate correction, or flag both for supervisor review.
Stage 2: Range and outlier checks
Every numeric field should have a plausible range defined before fieldwork starts (age 0–110, household size 1–25, monthly income within a sane multiple of the local median). Flag anything outside the range automatically, and flag statistical outliers — values more than roughly two standard deviations from the field's mean — for manual review even when they're technically possible, since a genuine outlier and a data-entry slip look identical without context.
Stage 3: GPS validation
Check every coordinate against the survey's intended geography: is it within the expected district or block boundary? Is it a null-island (0,0) placeholder? Is it improbably far from the enumerator's other submissions that day, suggesting either a genuine long-distance interview or a GPS fix error? A live field map that plots every submission against Synced/Approved/Flagged status makes this pass dramatically faster than scanning a spreadsheet of decimal coordinates — visual outliers jump out immediately.
Stage 4: Skip-logic consistency checks
Cross-check dependent answers: did a respondent marked "no children" somehow have data in the child-education section? Did someone who answered "not employed" report a monthly salary? These logical contradictions usually indicate either a skip-logic bug in the form itself or an enumerator overriding the flow manually. Either way, they need resolution before analysis, not after.
Stage 5: Final QA sign-off
Once the first four stages are done, a designated reviewer — not the person who did the cleaning — signs off on the cleaned dataset, with a short note on what was changed, what was dropped, and what remains uncertain. This sign-off step is what turns cleaning from an invisible, undocumented process into an auditable one, which matters enormously if a donor, government client, or peer reviewer later asks "how was this data cleaned?"
Reading a quality-score dashboard
Manually running all five stages on every survey wave is exactly the kind of repetitive, rule-based work that should be automated rather than redone by hand each time. A quality-score dashboard that tags every submission against a fixed set of checks turns the workflow above into something you can see at a glance rather than reconstruct from scratch.
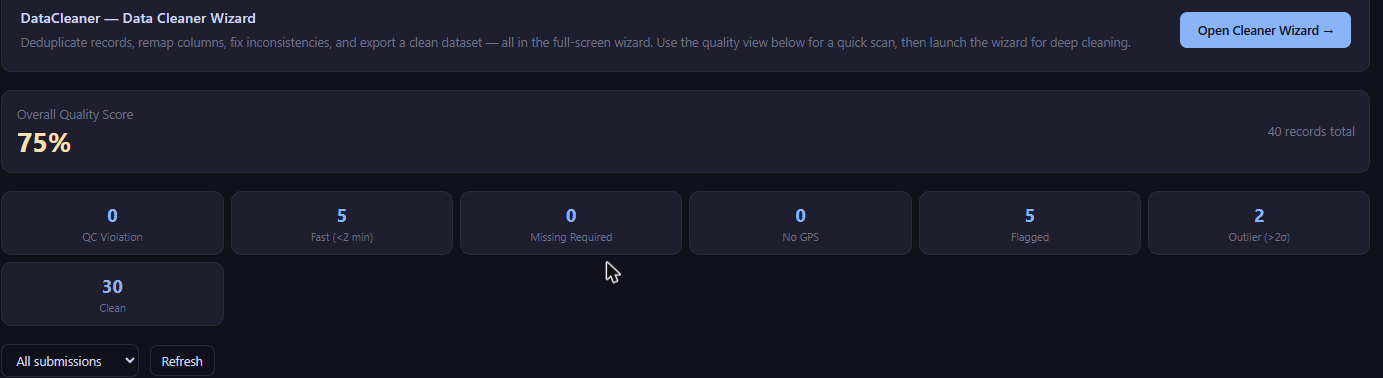
Here's what each category on a dashboard like this is actually catching, and why it matters:
| Category | What it catches | Why it matters |
|---|---|---|
| QC Violation | A logical or skip-logic contradiction — an answer that shouldn't be possible given earlier answers | Usually signals a form-logic bug or an enumerator overriding the intended flow; needs a form-design or training fix, not just a data fix |
| Fast (<2 min) | Submissions completed faster than a genuine interview of that length plausibly could be | Strong indicator of straight-lining, skipped questions, or fabricated ("curb-stoned") data |
| Missing Required | Required fields left blank, usually via an offline edge case or a form validation gap | Directly reduces the usable sample size for whichever indicator depends on that field |
| No GPS | Submissions with no location fix captured at all | Blocks geographic analysis, geofencing checks, and location-based back-checks for that record |
| Flagged | Records a supervisor has manually marked for review, independent of automated checks | Captures problems only a human reviewer would notice — contradictory notes, a suspicious respondent name, a gut-check concern |
| Outlier (>2σ) | Numeric values more than two standard deviations from the field's mean | Surfaces fat-finger entry errors and genuine extreme cases alike, both of which need a human look before they're trusted or dropped |
| Clean | Submissions that pass every automated check | The denominator that matters — your real, analysis-ready sample size, not just your raw submission count |
A 75% overall quality score does not mean a quarter of your data is garbage. It means a quarter of your submissions have at least one flag worth a human look — some will turn out fine on inspection (a genuinely fast but complete interview with a cooperative respondent, a legitimate income outlier from one wealthy household), and some will need correction or exclusion. The point of the score is to make that review targeted instead of exhaustive: instead of re-checking all 554 submissions, a supervisor reviews the roughly 140 that were flagged.
An outlier or a fast submission is a prompt to investigate, not an automatic delete. Dropping every flagged record without review can bias your sample just as badly as leaving bad data in — for example, systematically dropping every fast submission from one enumerator's most efficient (but legitimate) working days.
Building the second pass into your fieldwork calendar
The workflow above works best as a standing weekly (or even daily, during active fieldwork) routine rather than a one-time end-of-survey event. Waiting until data collection closes to run the first cleaning pass means any systematic problem — a mistranslated question, a GPS setting misconfigured on one enumerator's device, a training gap causing widespread straight-lining — has already contaminated the entire dataset by the time anyone notices.
- Daily or every-few-days: Run Stage 1 (dedup) and Stage 3 (GPS) checks on freshly synced submissions. These are fast, catch device/connectivity issues early, and let supervisors correct a misconfigured device before it produces another 200 bad GPS points.
- Weekly: Run the full five-stage pass on the week's cumulative data, including range/outlier and skip-logic checks. Review the quality score trend — a sudden drop for one enumerator or one village cluster is worth a phone call before it becomes a pattern.
- Post-fieldwork: A final, comprehensive pass across the whole dataset, culminating in the QA sign-off, before the dataset is handed to analysts or exported for reporting.
Common mistakes that undo a second pass
Even teams that adopt a structured workflow tend to fall into a handful of avoidable traps that quietly reduce how much it actually helps.
Cleaning without a data dictionary
Range checks and categorical standardization both depend on knowing, in advance, what each field is supposed to contain — the valid age range, the finite list of acceptable occupation categories, whether a "yes/no" field is genuinely binary or has a legitimate "not applicable" state. Teams that skip defining this before fieldwork starts end up making cleaning decisions ad hoc, field by field, which produces inconsistent results across analysts and makes the whole process much harder to audit later.
One person cleaning without review
Cleaning decisions involve judgment — is this outlier a genuine extreme value or a data-entry error, does this near-duplicate represent a real re-interview or a sync artifact — and judgment calls made by one person, with no second reviewer, accumulate a consistent bias in one direction over hundreds of decisions. The Stage 5 sign-off step exists specifically to catch this, and skipping it because it feels like an extra step is the single most common shortcut that erodes trust in a "cleaned" dataset later.
Treating cleaning as reversible when it isn't logged
If a cleaning pass edits or deletes values directly in the working dataset without keeping a record of what the original value was and why it was changed, there's no way to reconstruct or defend a decision later — which matters enormously if a donor auditor, a peer reviewer, or your own future self needs to understand why a given respondent's income field reads differently from the raw export. Cleaning should always produce a change log, not just a changed file.
What "clean enough" actually means
No survey dataset reaches 100% clean, and chasing that number past a reasonable point wastes fieldwork budget better spent elsewhere. A realistic target for most household or facility surveys is a quality score in the 85–95% range after the second pass, with every remaining flagged record explicitly reviewed and either corrected, annotated, or knowingly retained with a documented reason. What matters for credibility — with a donor, a government partner, or a peer reviewer — is not a perfect score but a documented, repeatable process that can be explained and defended.
Stop cleaning data by hand
FieldGovern's Cleaner module runs dedup, range checks, GPS validation, and quality scoring automatically on every submission — so your second pass takes minutes, not days.
Start Free Trial